Domaincer is currently at full project capacity until . We’ll be accepting new project discussions starting .
Domaincer is currently at full project capacity until . We’ll be accepting new project discussions starting .
Domaincer is currently at full project capacity until . We’ll be accepting new project discussions starting .
Domaincer is currently at full project capacity until . We’ll be accepting new project discussions starting .


Built for startup speed
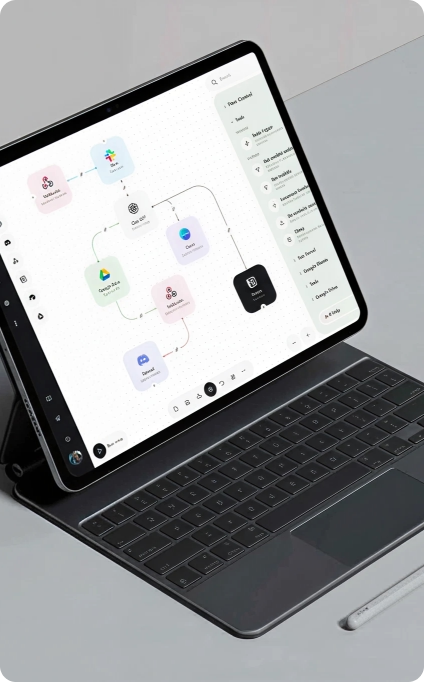
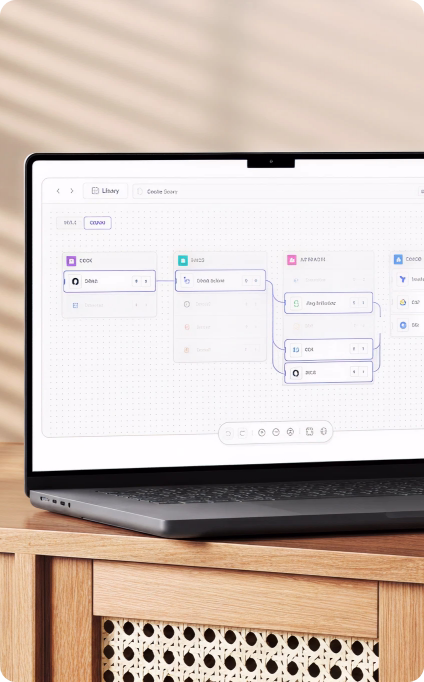
Domaincer combines lean teams of AI experts with pre-built
infrastructure that
accelerate your path to value with AI
Our approach for YC & Enterprises
Custom build with traditional SI
From Strategy to Deployment


Proven Client Wins
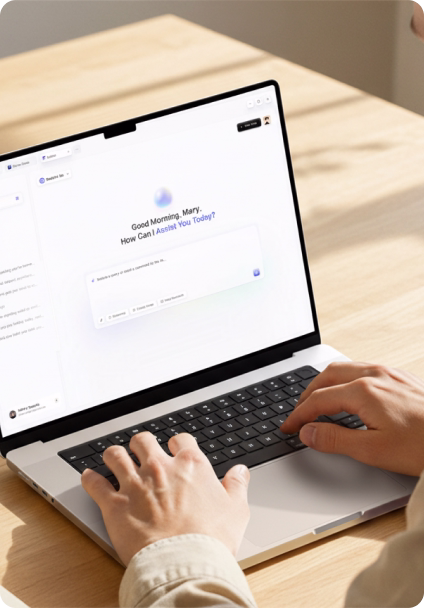
AI Video Interviewer
AI conducts, records, proctors, and evaluates in a video interview.
AI Phone Screener
AI conducts phone interviews, evaluates responses, & scores to identify the best fit.
AI Resume Screener
AI screens and analyzes resumes, ranks candidates, and delivers instant insights.


Enterprise Impact
Rapid ROI
Unlock measurable business value at lightning speed, reducing the gap between idea and impact.
World-Class AI Experts
Gain access to top-tier practitioners who bring years of hands-on experience in cutting-edge AI.
MVPs in Record Time
Transform concepts into fully functional prototypes within hours, not weeks.
Scalable, Future-Ready Architecture
Build flexible systems designed to adapt seamlessly as new models and technologies emerge.
Why Most AI Fails
95%
of organizations get zero return from GenAI due to brittle workflows & poor alignment.
30%
of AI initiatives get abandoned because of data issues, risk concerns, and escalating costs.
2x
Success rate of external partnerships compared to internal builds.
95%
of organizations get zero return from GenAI due to brittle workflows & poor alignment.
30%
of AI initiatives get abandoned because of data issues, risk concerns, and escalating costs.
2x
Success rate of external partnerships compared to internal builds.
Trusted Across Industries
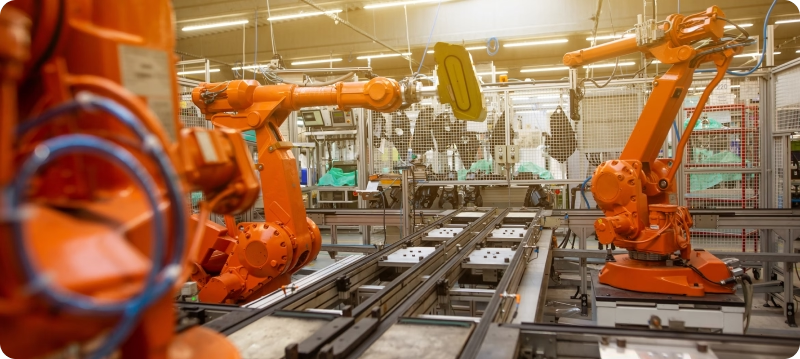
Predictive Maintenance, AI Production Optimization, AI Quality Control

Predictive Diagnostics, Patient Data Analysis

AI ATS, AI Interviewer, AI Screener

AI Agents, Voice AI Chatbots, API Development & Integration

Inventory Optimization, Customer Engagement

Market Analytics, Property Management

Road Condition Monitoring, AI Navigation

Predictive Equipment Maintenance, Pipeline Monitoring, Safety & Risk Analytics
Technology Allies


Global Standards

100% AI-Focused Agency
Chosen by YC Founders

Trusted by Enterprises

18 Years of Tech Excellence
50+ AI Agents Deployed
Quick Help